How much does it cost to buy a house in the bay area?
Adam Schwartz
Last updated: 7/27/04
Introduction
Buying a house is the largest, most complex and most important economic decision that most people will ever make. Yet most people buy a house with little or no understanding of the economics involved. The decisions of where to buy and how much to pay are complicated enough. But there are other variables like what type of loan (fixed, variable, interest-only, no down payment) to get and unknowns such as what will interest rates do and will home prices continue to appreciate that complicate matters. This site will try to provide you with the knowledge and tools necessary to make an informed decision about buying a home.
Conflict of Interest and History
People often obtain guidance on these matters from their real estate agent and mortgage broker. This is unfortunate because both of these agents have a vested interest in representing an optimistic view of the real estate market. There’s also the unfortunate situation in that both the buyer’s and seller’s agent benefit from a high sale price since their commission is based on the sale price.
You may hear such comments as:
· Housing prices always go up
·
There’s never been a year in which house values
have dropped everywhere in the
· If you buy a house, at least you’re building up equity; if you rent you’re just throwing your money down the drain
· Prices can’t go down because there is a limited supply and the bay area is a special place to live
· Even though the market has had serious declines before, this time is different…
All of these statements are, in fact, incorrect or misleading.
·
Housing prices have not always gone up. For instance, in
· This is a silly statement. Housing markets are regional. Some regions see increases while others see decreases. The chances of all regions simultaneously seeing a decrease is slim to none.
· This is a platitude that glosses over a more rigorous understanding of the economics involved. The real question is what’s your net wealth after a given number of years if you decide to buy a home versus renting. The calculator provided below will answer this question for you.
·
In fact, the supply of housing has increased in
the bay area while the population has decreased. For instance, between July 1, 2001 and July
1, 2002
· Right. And the dot-com area was different too! Even if you had bought Amazon.com, which is one of the few profitable non-pornographic websites, at its high at the end of 1999 and held until today, you’d have lost half of your money. If you bought any of most of the other dot-com’s all I can say is sorry you lost all of your investment.
I, too, have a conflict of interest: I am a renter and think home prices are too high in the bay area.
The Trend in Bay Area Home Prices
OK, let’s see some numbers.
The first graph shows the skyrocketing housing prices in
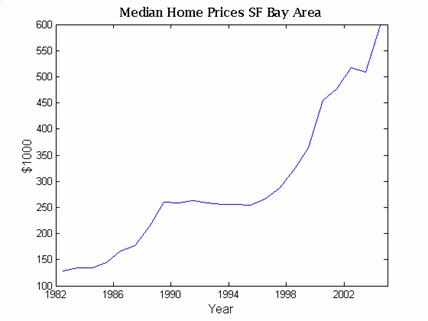
The median home price in SF increased by 366% between 1982 and mid-2004. That’s about a 12% compounded yearly growth rate. Not bad. Of course, if you had invested that money in the S&P500 your return — even after the crash of 2000 — would have been 800%, a 21% annual compounded return! The historical stock market return is about 11% per year.
Now, in order to get a sense of what might happen to prices in the future it is worthwhile to correlate them with two other important factors: interest rates and personal income. The next graph shows the interest rate yield on the 30 year US Treasury bond. Mortgage rates are similar to the 30 year T-bill.
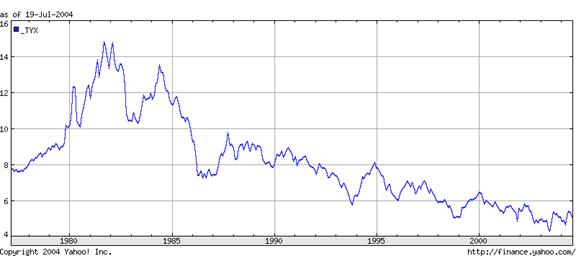
Note that interest rates peaked around 1982 and have been
declining ever since. This is critical
because everything else being equal
the affordability of home ownership is inversely proportional to interest rates[4]. For instance, if interest rates increase from
5.5% to 6.0% (an increase of 9%) then home prices would have to drop by 9% to
keep mortgage payments the same. In
fact, if you look at home prices in
However, home prices in
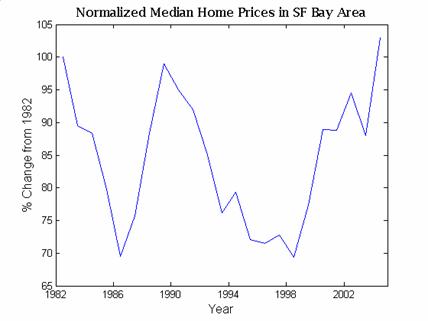
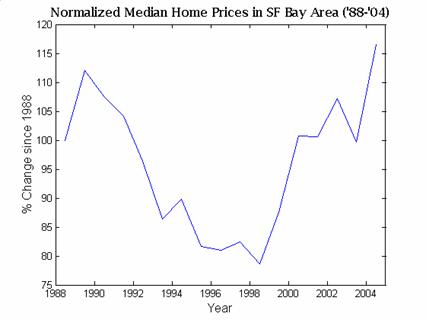
This graph shows that with interest rates and personal income held constant, home prices in the bay area are about the same as in 1982. Note that this graph has to be taken with a grain of salt because interest rates (particularly between 1982 and 1987) fluctuated wildly. If we look at the same graph starting from 1988 it appears that home prices are 17% more expensive, relative to interest rates and incomes, than in 2004 than in 1988.
Roughly speaking this graph says that if you think personal income will remain flat for a while and, at the same time, you think that interest rates will be flat or will increase then, almost certainly you should expect home prices to fall. And note that long-term interest rates are at a historic low right now. Only a full-on recession could prevent interest rates from rising.
Other Points of View
If you want to see arguments representing the extreme points of view on this topic I would recommend:
· Patricks’ website for the pro-housing bubble point of view.
· The National Association of Realtors for the everything-is-rosy point of view.
·
If you think of a house as an investment, take a
look at this article by
Edward Leamer of the UCLA
How to Figure it out Yourself
OK, so you want to own a home. How do you decide if buying is a good investment? In order to shed some light on this question I have created an easy-to-use Excel spreadsheet that calculates the economic cost of buying a house. The spreadsheet looks at two questions:
- Cost of buying versus renting. This calculation determined how much more or how much less money you will have if you buy a house instead of renting and sell that house after a certain number of years.
- Affordability. This calculation addresses the issue of how much money you will have leftover each month after you pay your mortgage and other home ownership costs. It takes into account tax advantages of owning a home (which are huge). Basically, this is the calculation you should look at if you’ve decided that, regardless of the investment value, you must own a home.
Also, for your convenience you’ll see in the amortization table a column labeled, “effective monthly payment”. This is your yearly house costs minus tax advantages divided by 12. It’s a useful way to directly compare how much you’ll pay per month to own a house versus monthly rent payments.
In this spreadsheet you should only modify cells that are bold black. Other cells are calculated.
Important assumptions:
- I do not warrant the accuracy of this
spreadsheet. It is for
informational purposes only. If you
make a decision based on this spreadsheet and don’t like the outcome I am
not liable in any way. By using
this spreadsheet you agree to use it at your own risk and not sue me or
shoot me or something like that.
Seriously.
- The calculation assumes a fixed interest rate lone. You can potentially pay less with other types of loans (variable, interest-only, no down payment …) but at the cost of assuming greater risk to interest rate fluctuations and price volatility in the market.
- I have only included two tax categories: single and married filing together. If you want to change the spreadsheet for married filing separately or head of household be my guest.
- I don’t deal with all the little factors that may come in to play. For instance, if you pay less than 20% down you may have to purchase additional mortgage insurance. That’s not included in this spreadsheet. Certain ATM limits on deducation are also no accounted for.
- Depending on when you use this spreadsheet, some things like the tax tables may be out of date.
- To run this spreadsheet you must allow macros. Set security to medium level (Tools->Macro->Security), re-start Excel and allow macros.
Final Thoughts
- The recession following the 2000 stock
market bust was mild (unemployment only reached 6%) and did little to correct
the imbalances in our economy.
Indeed, falling interest rates allowed the housing market to remain
robust. This allowed consumers
equity to rise and, along with three Bush tax cuts, encouraged strong
consumer spending. Consumer
spending accounts for 2/3rds of the GDP.
- However, the
- If the economy takes another downturn,
there is little buffer left to protect the housing market. Interest rates can't go much lower,
personal debt is already way too high, most people have already
re-financed and in the process taken additional equity out for spending
through the recession, foreclosures and bad loans are up, the
affordability index is at an all-time low.
